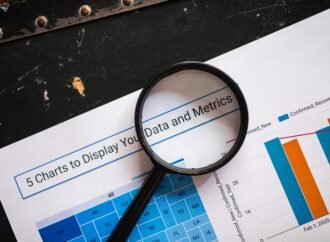
Explore how modern data visualization tools transform raw data into interactive, compelling stories that drive smarter business decisions.
Data visualization is more than just presenting charts and graphs—it’s about transforming raw data into compelling visual stories that drive strategic decision-making. In an era where data is at the core of business success, modern visualization tools like Tableau, Power BI, and Looker empower organizations to turn complex datasets into interactive, dynamic narratives that uncover trends, patterns, and opportunities at a glance.
Key Elements of Effective Data Visualization
1. Interactive Dashboards
Gone are the days of static reports. Today’s tools enable users to interact with charts, filter data in real time, and drill down into granular details. Whether exploring sales trends or operational performance, interactive dashboards put insights at users’ fingertips, enhancing data exploration and discovery.
2. Real-Time Data Updates
Data is constantly evolving, and so should visualizations. Modern tools ensure real-time data streaming and automatic updates, allowing businesses to monitor KPIs, track trends, and respond to changes instantly. This is crucial for industries like finance, e-commerce, and supply chain management, where timely insights drive competitive advantage.
3. Storytelling with Data
Data visualization is not just about displaying numbers—it’s about telling a story. By using sequential visualizations, annotations, and guided narratives, businesses can provide context and meaning to their data. A well-crafted visual story helps audiences understand insights faster, identify trends easily, and make informed decisions with confidence.
4. Customization and Flexibility
One size does not fit all when it comes to data visualization. The ability to tailor charts, dashboards, and reports to specific business needs and branding ensures clarity and impact. From custom color schemes and typography to industry-specific visualization types, businesses can enhance readability and engagement while maintaining consistency in their reports.
Why Embrace Modern Data Visualization?
By leveraging advanced data visualization techniques, organizations can:
- Simplify complex data for better understanding
- Enhance decision-making with clear, data-driven insights
- Uncover hidden patterns and opportunities in large datasets
- Improve collaboration by making insights accessible to all stakeholders
In today’s fast-paced, data-driven world, communicating insights effectively is just as important as discovering them. The right visualization strategy ensures that businesses don’t just collect data—but use it to drive meaningful action and innovation.


